The connection to the science is vital to and expanded knowledge of climate change, as I mentioned in the post on the Foundations of Climate Change Inquiry. One of those foundations mentioned is the work of the Intergovernmental Panel on Climate Change, which is the body of the United Nations focusing on the global science and impacts related to climate change. Their October 2018 IPCC Special Report focuses on “the impacts of global warming of 1.5°C above pre-industrial levels and related global green house gas emission pathways, in the context of strengthening the global response to the threat of climate change, sustainable development, and efforts to eradicate poverty.”
Here, I’m going to focus a bit on the summary, as this is a full report I’ve not read in depth. At a base level, the difference between 1.5°C and 2°C is a key distinction in this document, as it provides a ton of research and information that gives the impacts relative to those two temperature thresholds. The document is broken into four major sections,:
- A: Understanding Global Warming of 1.5°C
- B: Projected Climate Change, Potential Impacts and Associated Risks
- C: Emission Pathways and System Transitions Consistent with
1.5°C Global Warming - D: Strengthening the Global Response in the Context of Sustainable Development and Efforts to Eradicate Poverty
As this is a bunch of new terms and concepts for non climate scientists or policy folks, the summary of terms and Core Concepts Central to this Special Report is a helpful addenda, with terms and definitions.
A. UNDERSTANDING GLOBAL WARMING
The big picture of the report is that we’re currently around 1°C of global warming, compared to pre-industrial levels, which in this case is defined as “the multi-century period prior to the onset of large-scale industrial activity around 1750.” As mentioned, there is a reference period from 1850-1900 in which they approximate this pre-industrial Global mean surface temperature (GMST). This baseline for warming gives a point in time, and thus is the context for trends, such as the warming of 0.2°C per decade, which as mentioned in the report is “due to past and ongoing emissions”. While this is an average for the global temperature, there’s obvious variations, with more warming on land versus oceans, and regions like the Arctic warming up to 2 to 3 times faster than others.”
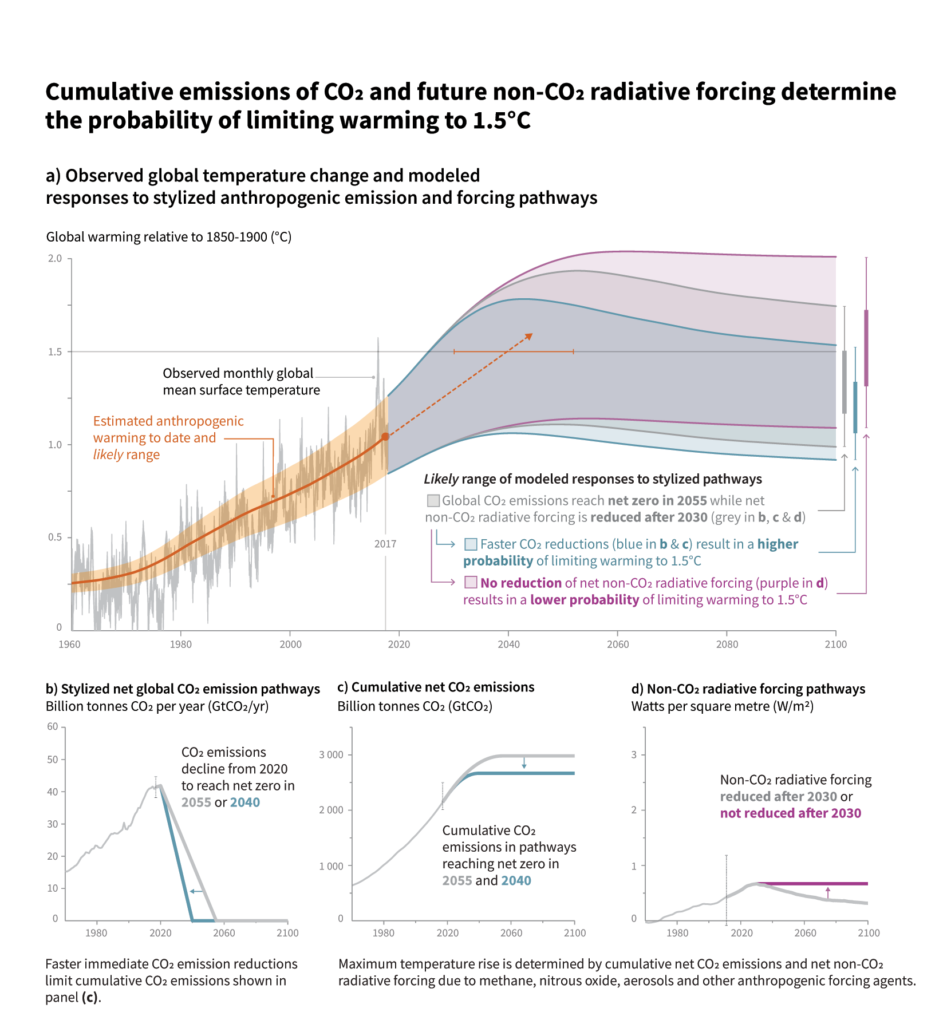
The indisputable scientific fact now is, of course, that the warming is coming from human activity, or “anthropogenic emissions” and that those impacts are already being seen. What was interesting to read in multiple sources including this report, was that the die has been cast, to a degree, and even if we stopped greenhouse gas (GHG) emissions today, the warming trends will continue for decades and impacts like sea-level rise are, in fact, inevitable to some degree.
The big question (issue) here is that we are obviously still emitting massive amounts of CO2 and that the estimated impacts are related to rising temperatures caused by continually rising amounts of GHGs in the atmosphere. This is a product of ‘radiative forcing’, which is the amount of heating due to the “difference between insolation (sunlight) absorbed by the Earth and energy radiated back to space.” (via) The graphic from the report shows the current trajectory and alternative pathways if we stay within a rise of only 1.5°C, which all show a downward path.
B. PROJECTED CLIMATE CHANGE
The climate change models provide a context and ability to compare impacts from 1.5°C and 2°C changes, and thus project potential impacts. For instance there will be increases in temperatures, hot extremes, heavy precipitation, and droughts, each manifesting regionally with the amount of impact depending on many factors like geography, level of development, and potential adaptation strategies. All in all, by holding to a 1.5°C rise in temperatures, the intensity of impacts will be less.
For instance, a specific case like global mean sea level rise (SLR) can be measured and compared. The estimated SLR for 1.5°C rise in temperatures is somewhere between 0.26 and 0.77 meters by 2100, or somewhere between 10 – 30 inches. If GHG emissions are not curtailed, and temperatures rise another 0.5°C beyond this, the SLR will increase by another 0.1 meter (around 4 inches) which seems minimal, but will have impacts to steadily increasing areas. More important than the amount is that by slowing the temperature increase, it buys us time. From the report (section B.2), a slower rate provides “greater opportunities for adaptation “in the human and ecological systems of small islands, low-lying coastal areas and deltas”
This played out similarly in thawing permafront, impacts to biodiversity, rising ocean temperatures and increase acidification, with steadily increasing impacts such as species migration, and extinctions, and sometimes reaching critical tipping points where we lose the potential to return systems back to their current state. These thresholds also have larger and lasting impacts to human health and livability of our planet – including a laundry list of impacts (physical, social, and economic), often disproportionately felt by vulnerable populations. Again the ability to keep warming from 1.5°C instead of 2°C doesn’t eliminate these impacts, but reduced the severity and costs, and provides us with more options, and time to adapt.
This section does provide an interesting summary of some of those potential adaptation strategies that is worth sharing, as it relates very specifically to the work of designers and planners by having a site-specific and spatial component. From section B.6.1, the adaptations can reduce risk to:
- Natural and Managed Ecosystems
- ecosystem-based adaptation
- ecoystem restoration and avoided degradation and deforestation
- biodiversity management
- sustainable aquaculture
- local knowledge and indigenous knowledge
- Sea Level Rise
- coastal defense and hardening
- Health, Livelihood, Food, Water, Economic Growth, especially in rural areas
- efficient irrigation
- social safety nets
- disaster risk management
- risk spreading and sharing
- community based adaptation
- Urban Areas
- green infrastructure
- sustainable land use and planning
- sustainable water management
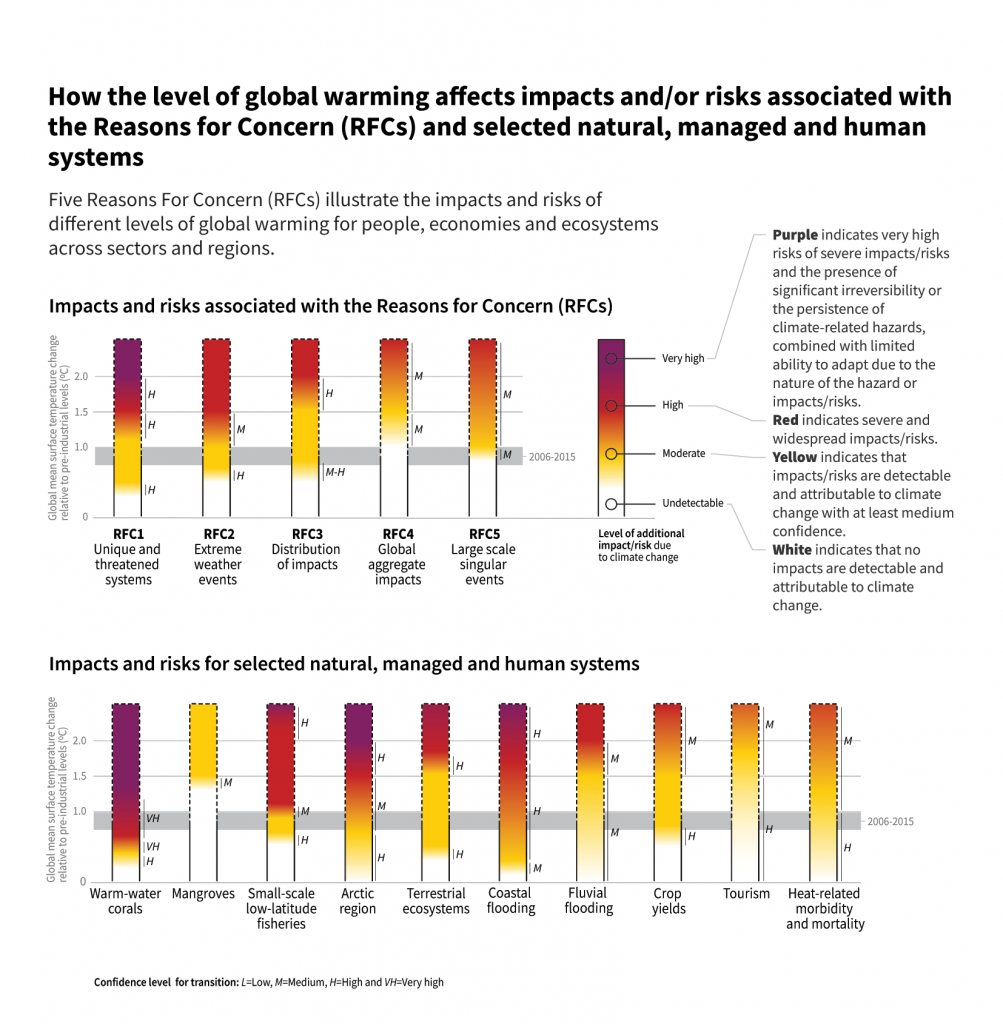
The final part of this section is the concept of ‘Reasons for Concern‘ or RFCs, which is a way of classifying risks, and to show the way these are evaluated in the context of natural, managed, and human systems. Again, worth summarizing as they give a way to assess those impacts (along with the graphic below) across sectors and regions.
- Unique and threatened systems: ecological and human systems that have restricted geographic ranges constrained by climate-related conditions and have high endemism or other distinctive properties. Examples include coral reefs, the Arctic and its indigenous people, mountain glaciers and biodiversity hotspots.
- Extreme weather events: risks/impacts to human health, livelihoods, assets and ecosystems from extreme weather events such as heat waves, heavy rain, drought and associated wildfires, and coastal flooding.
- Distribution of impacts: risks/impacts that disproportionately affect particular groups due to uneven distribution of physical climate change hazards, exposure or vulnerability. *
- Global aggregate impacts: global monetary damage, global-scale degradation and loss of ecosystems and biodiversity.
- Large-scale singular events: are relatively large, abrupt and sometimes irreversible changes in systems that are caused by global warming. Examples include disintegration of the Greenland and Antarctic ice sheets.
C. EMISSION PATHWAYS AND SYSTEM TRANSITIONS
This section is more focused on the science and the specific emissions pathways, along with the metrics on total carbon budget. While essential to understanding the increased emissions and impacts on rising temperatures, there’s fewer details I want to focus on. There are a few key ideas that emerge from this section, focused around mitigation opportunities for landscape strategies and within urban areas.
Tied to the relative global warming numbers of 1.5°C or 2°C which have been discussed previously, there’s a larger concept of the associated ‘total carbon budget’, which is an estimate of the amount of net anthropogenic CO2 emissions that can be in the system to keep warming at a certain level. Using the 1.5°C target, since pre-industrial times, through 2017, we have reduced the carbon budget by 2,200 gigatons of CO2 in that timespan. Thus there are levels of the ‘remaining carbon budget’ that we have available, which according to the report is around 580 gigatons of CO2 left. If you use the current rate of emissions of 42 gigatons of CO2 year, it’s pretty easy to do the math and see the timespan in which we will deplete our budget. This is the ’12 years’ that many mention as a critical timeline to a point-of-no-return. Obviously this doesn’t mean the world ends, as we have the ability to ‘overshoot’ and then return back to acceptable levels, but these are also potentially conservative numbers, and per the report, don’t take into account “potential carbon release from permafrost, methane release from wetlands”, which will reduce this budget even more.
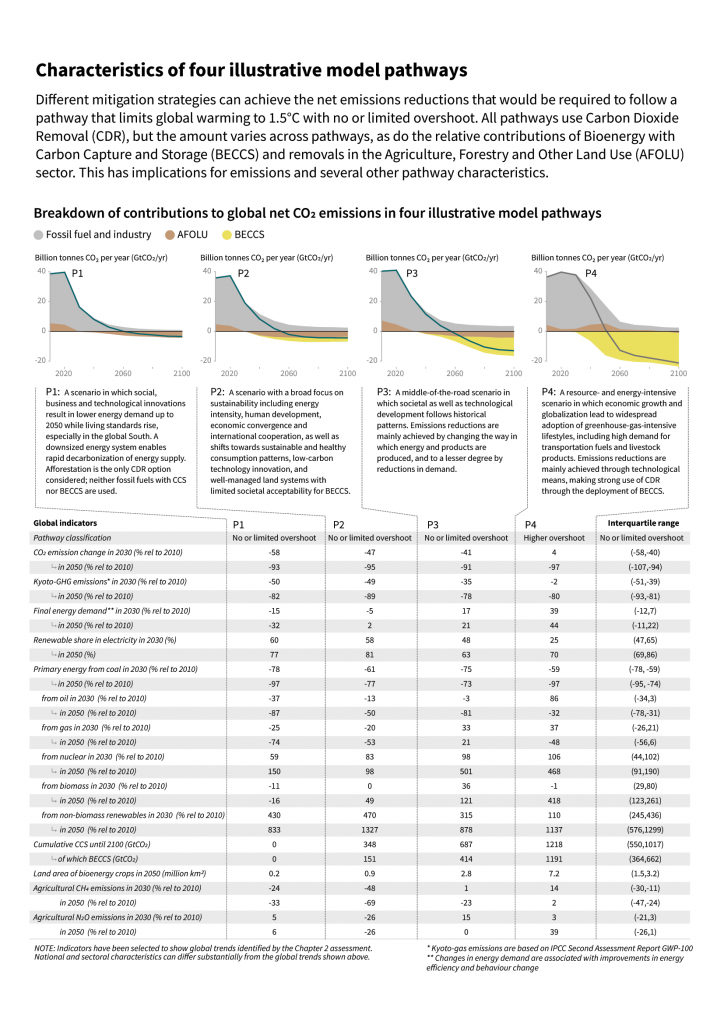
While it’s a bit overwhelming as a graphic, it’s worth looking at the figure from the report that shows the “Characteristics of Four Illustrative Model Pathways”, in particular the potential for strategies to reduce carbon, including Bioenergy with Carbon Capture and Storage (BECCS) and Agriculture, Forestry, and Other Land Use (AFOLU) both of which are interesting ways to ramp up mitigation by use of innovative strategies. I’ll elaborate on these further in the post.
The wide array of options for mitigation are collectively referred to as “system transformations”, as I mentioned, interesting as they include a number of landscape-specific ideas. And, based on the dire predictions of our available remaining carbon budget, reductions alone will not suffice to get us to levels that can keep warming at 1.5°C or even 2°C, especially without overshoot. Per section C.2 we require:
“…rapid and far-reaching transitions in energy, land, urban and infrastructure (including transport and buildings), and industrial systems. These system transitions are unprecedented in terms of scale, but not necessarily in terms of speed, and imply deep emissions reductions in all sectors, a wide portfolio of mitigation options and a significant upscaling of investments in those options.”
As I mentioned, efficiency is one aspect, and a combination of new and existing technologies are needed, including “electrification, hydrogen, sustainable bio-based feedstocks, product substitution, and carbon capture, utilization and storage (CCUS)”, to name but a few. I think of the book Drawdown as a good snapshot of many of these strategies and their potential. However, as mentioned, while these are technically proven at a number of scales, large-scale deployment of these is constrained, and often has trade-offs with other strategies.
We also need changes in systems, for instance section C.2.4 mentions urban and infrastructure system transitions, which imply “changes in land and urban planning practices, as well as deeper emissions reductions in transport and buildings…” to get us to these targets. Many of these are not new, but do come with some baggage: “Economic, institutional and socio-cultural barriers may inhibit these urban and infrastructure system transitions, depending on national, regional and local circumstances, capabilities and the availability of capital.”
The final section does present some interesting options, specific to CO2 removal, which are collectively referred to as CDR for “carbon dioxide removal” which range in potential. These include:
- afforestation and reforestation
- land restoration and soil carbon sequestration
- bioenergy with carbon capture and storage (BECCS)
- direct air carbon capture and storage (DACCS)
- enhanced weathering and ocean alkanlinization
Two mentioned previously have some huge potential. For instance BECCS can capture up to 5 gigatons of CO2 per year, and afforestation an additional 3.6 gigatons of CO2 per year. As we find out more about the potential we can employ these strategies at larger scales, however there are trade-offs, such as the competition with other land use (for instance agriculture for food production) and the need to protect valuable ecosystem resources. One strategies mentioned is to use multiple, small installations, versus massive projects, to spread out impacts.
Related specifically to landscape systems, the connection to ecosystem services is highlighted with the multi-functional benefits, as mentioned in section C.3.5. The use of Agriculture, Forestry and Other Land Use (AFOLU) measures for CDR, have a number of co-benefits, such as restoration of natural ecosystems providing additional soil carbon sequestration, increased biodiversity, soil quality, and food security, if managed sustainably.
D. STRENGTHENING THE GLOBAL RESPONSE
The final section is more about connecting these ideas to larger concepts. The CDR strategies above can only work if we start now, and have significant gains prior to 2030, to avoid overshooting temperature levels. There are multiple reasons for this, as mention in D.1.3: “…challenges from delayed actions will cost more money, lock-in carbon-emitting infrastructure, stranded assets, and reduced flexibility in future response options in the med. and long-term.” This will also result in impacts being even more uneven between developed and developing countries.
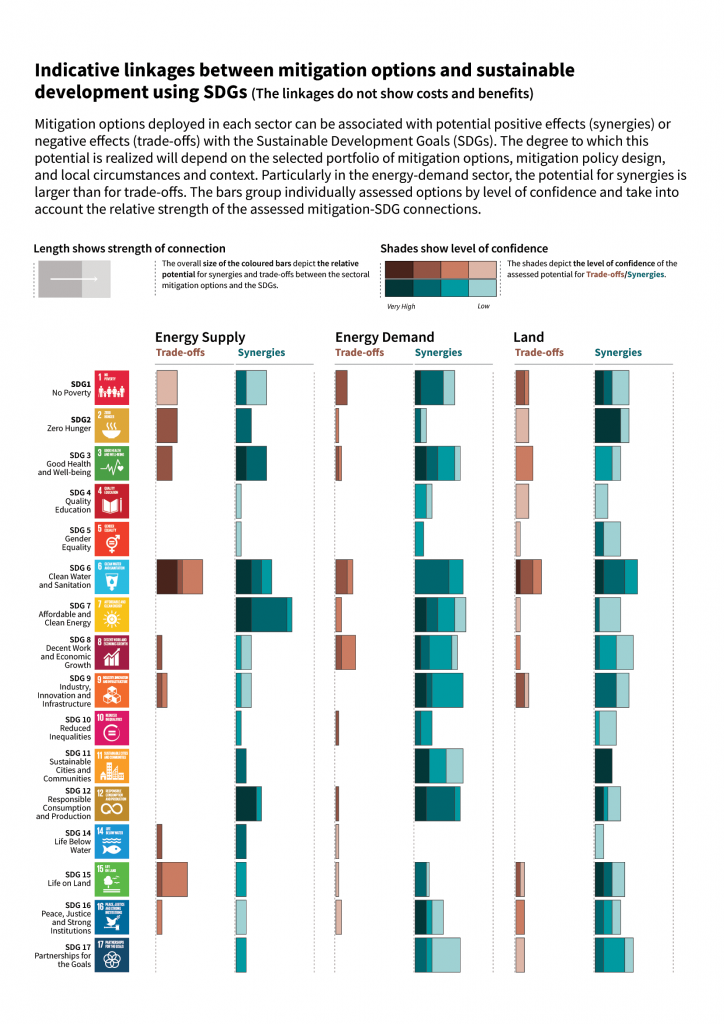
Because the IPCC is UN based, it makes sense to link mitigation options and how they work with the UN Sustainable Development Goals – both positively in synergies but also negatively in terms of trade-offs. By tying this into the existing systems, we can look at adaptations that, according to section D.3, “…reduce vulnerability of human and natural systems.” Specific overlaps and syergies between the two include:
- food and water security
- reduced disaster risks
- improving health conditions
- maintaining ecosystem services
- reducing poverty and inequality
There’s multiplier effects as well, for instance the ability to create compact cities can reduce emissions, as well as disaster risk, and at an smaller scale, “low-carbon buildings are designed for efficient cooling”, which further helps reduce emissions.
The trade-offs and (one of my favorite new words ) “maladaptions” can also result from this, with strategies, including increased greenhouse gas emissions, increased water use, increased gender and social inequity, worsening health conditions, and encroachments on natural ecosystems, to paraphrase the report.
The scale of the system transitions is important to keep in mind, and this gets at the role of planners and designers in implementing systems that meet multiple needs, address risks, manage equity, and balance synergies and trade-offs. Bad design can have serious consequences, and good design can maximize synergies. As the report reinforces, section D.4.3:
“Context-relevant design and implementation requires considering people’s needs, biodiversity, and other sustainable development dimensions.”
The overall investment is huge, but perhaps modest in terms of the massive costs that may result from inaction. The estimated cost globally to get to 1.5°C is $2.4 trillion, which is around 2.5% of the global GDP, which is a bargain compared to estimate of 20-40% of GDP for dealing with consequences of further warming trends, not to mention the suffering and loss of life. The IPCC’s weaving together of climate strategies and sustainable development goals is win-win both in cost and the ability to leverage assets, maximize cooperation and partnerships, with a goal of looking at both the “pursuit of climate-resilient pathways with mitigation and adapation” and “poverty eradication and efforts to reduce inequalities.”
The collective efforts to meet these needs final words of the report give the context: “Collective efforts at all levels, in ways that reflect different circumstances and capabilities, in pursuit of limiting global warming to 1.5°C, taking into account equity as well as effectiveness, can facilitate strengthening the global response to climate change, achieving sustainable development and eradicating poverty.”
—
:: ADDITIONAL RESOURCE: IMPACTS FOR CITIES For a bit more specificity on the content of the above IPCC Special Report, there’s a Summary for Urban Policy Makers which provides a rich, focused review of the above information, focused for urban policymakers. A follow-up soon on this report as it has some great info and graphics worth sharing.
4 thoughts on “You Down with IPCC?”