The scientists at the Oregon Climate Change Research Institute (OCCRI) issued some state-specific information that augments other national climate reports. Their Fourth Oregon Climate Assessment Report was issued at the end of January 2019, focusing specifically on the “state of knowledge of climate science as it pertains to Oregon”
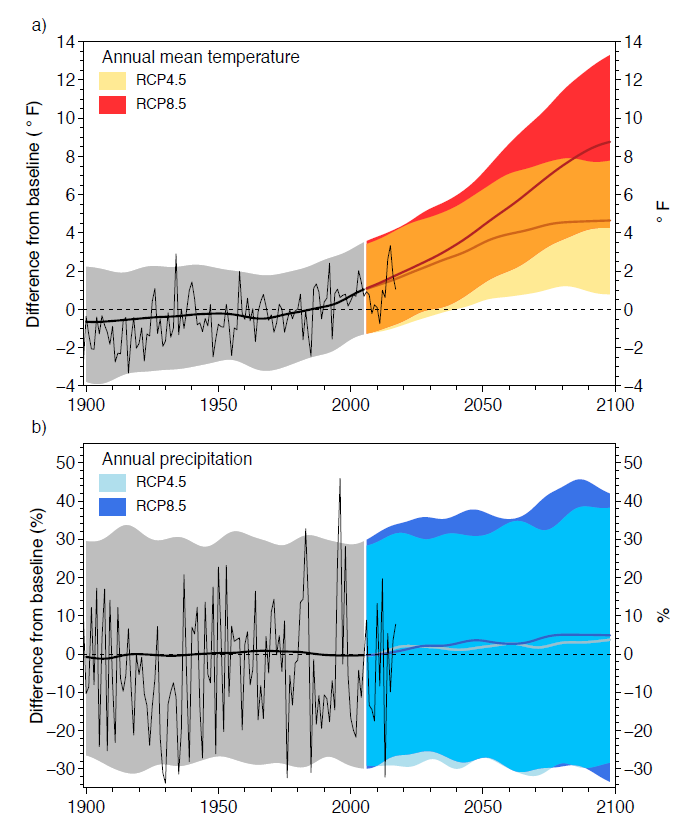
The concise report outlines key issues related to Oregon climate, “covering the physical, biological and social dimensions.” A summary gives a quick snapshot, and the report has a number of helpful graphics to tell the story visually. Mirroring global trends, Oregon also is trending warmer, as seen in Figure 1a, with the hottest recent year of 2015 setting the trend, but also including warming in many of the recent years. It’s interesting to note in Figure 1b, which shows that precipitation is not rising as much, as noted in the report: “Annual precipitation, unlike temperature, has no long-term trend towards wetter or drier. Most recent years have been fairly close to average, with the exception of 2018, which was much drier than average based on NOAA data available in December.” (p.3)
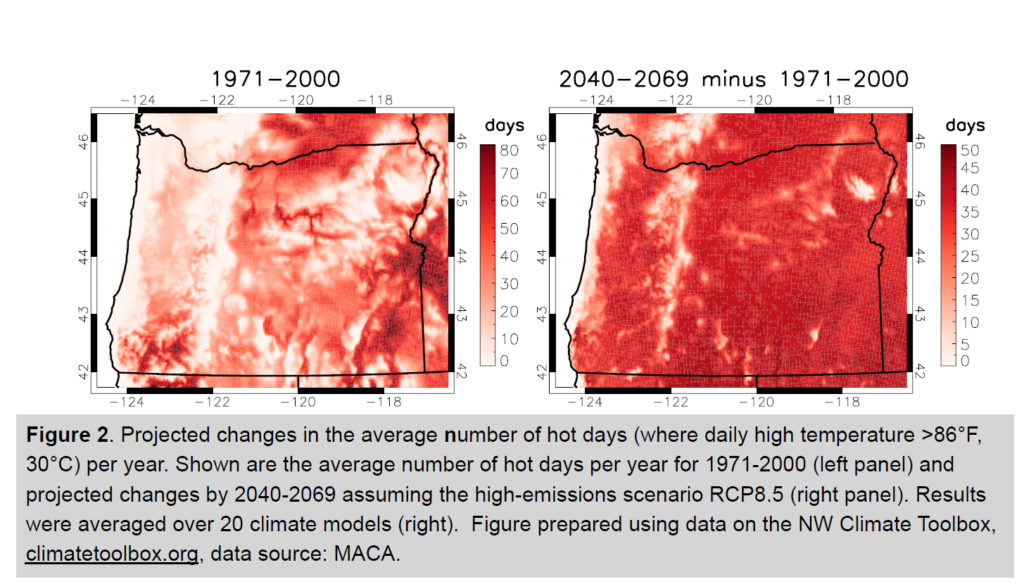
Subsequent sections and maps discuss, the use of downscaled global climate models (GCMs) as well as regional modelling for more fine grain analysis. Topics include the number of ‘hot days’, which for Oregon is considered to be above 86 degrees F. Mapping of current trends and comparisons to projected changes based on specific climate warming scenarios. For instance, as that seen in Figure 2, the maps highlight the fact that most areas of the state, under RCP8.5, places will have significantly more of those ‘hot days’, with the exception of the higher elevation mountain zones and coasts.
Other maps reinforce changes in growing seasons, and again, under the more extreme RCP8.5 scenario, show massive increases in growing seasons (up to 2 months longer), changes in spring thaw and fall freeze timing, all of which will transform the landscape of the region, which will have multiple impacts to agriculture, landscape systems, and forests. Figure 4 highlights changes in mean temperatures changes, even for the lower RCP4.5 scenario, and accentuates the extreme changes that could happen, capturing the regional variation as well. While the coastal areas will rise 0.4 degrees F every decade, the remaining parts of western Oregon will see a 0.7 degree F rise and eastern Oregon would be even more extreme, with almost a 1 degree F change per decade (0.9 deg F) during summer.
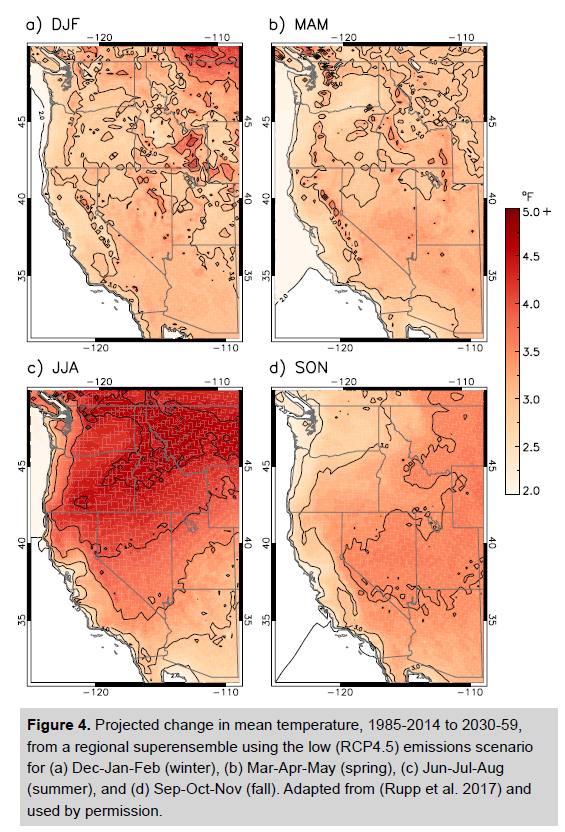
The maps show that additional detail that is modeled, allowing more specific insight to state-wide issues that may not be resolved in larger GCMs. As mentioned, the OCCRI:
“…runs a fine-scaled (25 km) regional model to more accurately simulate the physical processes associated with topography like mountains which influence the responses of the atmosphere (and hence temperature and precipitation) to rising greenhouse gases.” (p.3)
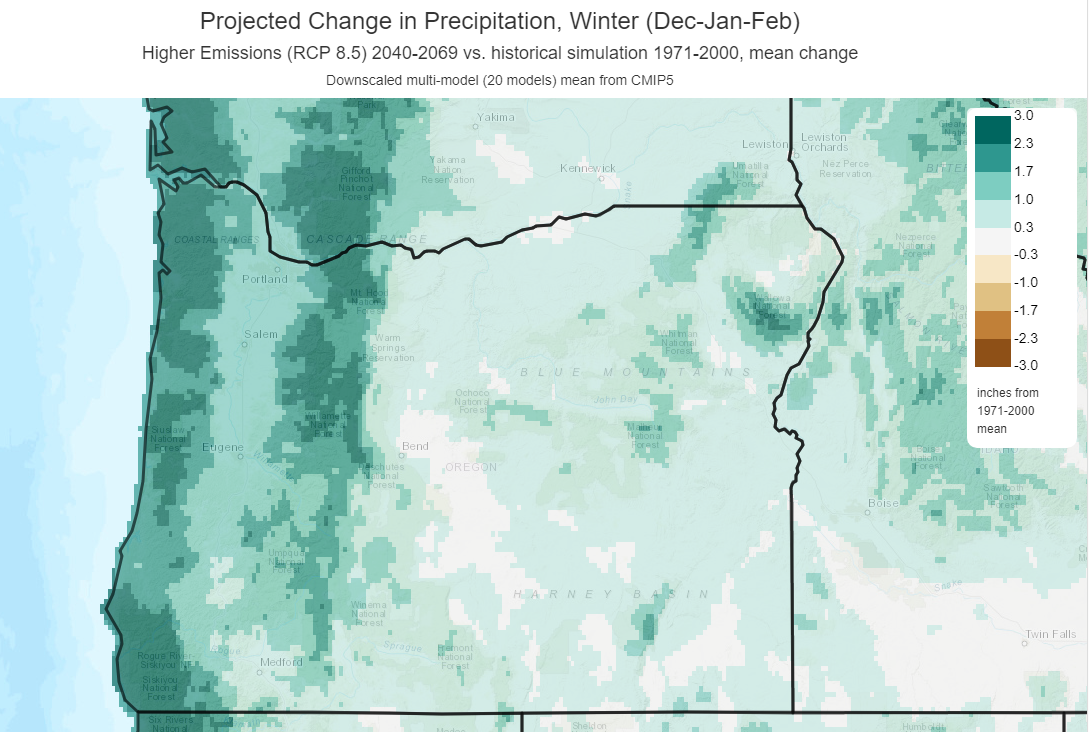
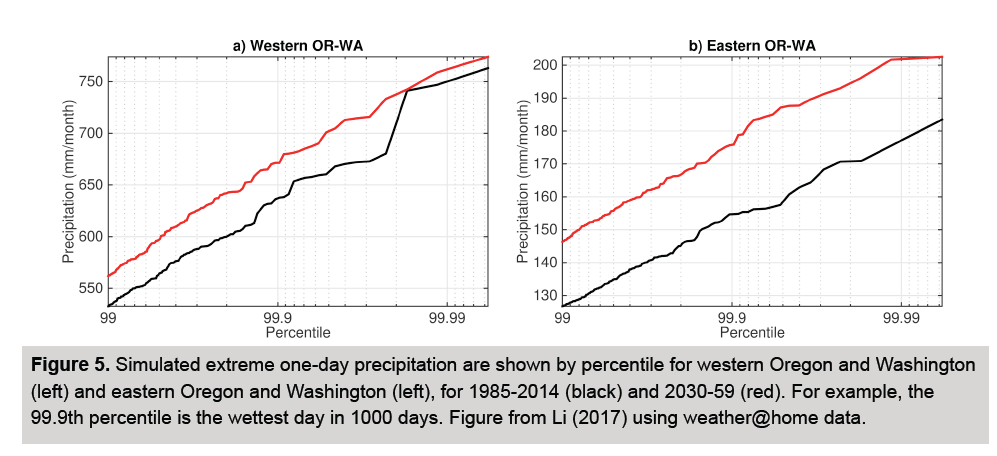
While earlier it was mentioned that precipitation trends are not as noticable, the models do show changes in extreme events. While a modest increase in winter precipitation, and a slight decrease in summer precipitation is seen, the regional effects including a weaking of the “rain shadow” effect, and greater increases (up to 20%) East of the Cascades, and some, yet smaller increases (up to 10%) on the west sides. This is seen graphically in Figure 5 (p.6), which highlights the difference between the 99.9 percentile storm extreme from today and how it will be more divergent in the east portions of Oregon and Washington.
Critical for the Northwest and Oregon as well is snowpack, and the difference soil moisture regimes in winter (wetter) and summer (driers) and how this will exacerbate droughts and flooding, specifically in terms of snowmelt and alignment with streamflow. The impacts to water access will be huge, as it is predicted that stream flows in some basins will be up to 50% less as modeled in June, which impacts fish, recreation, wildfire danger and many other issues.
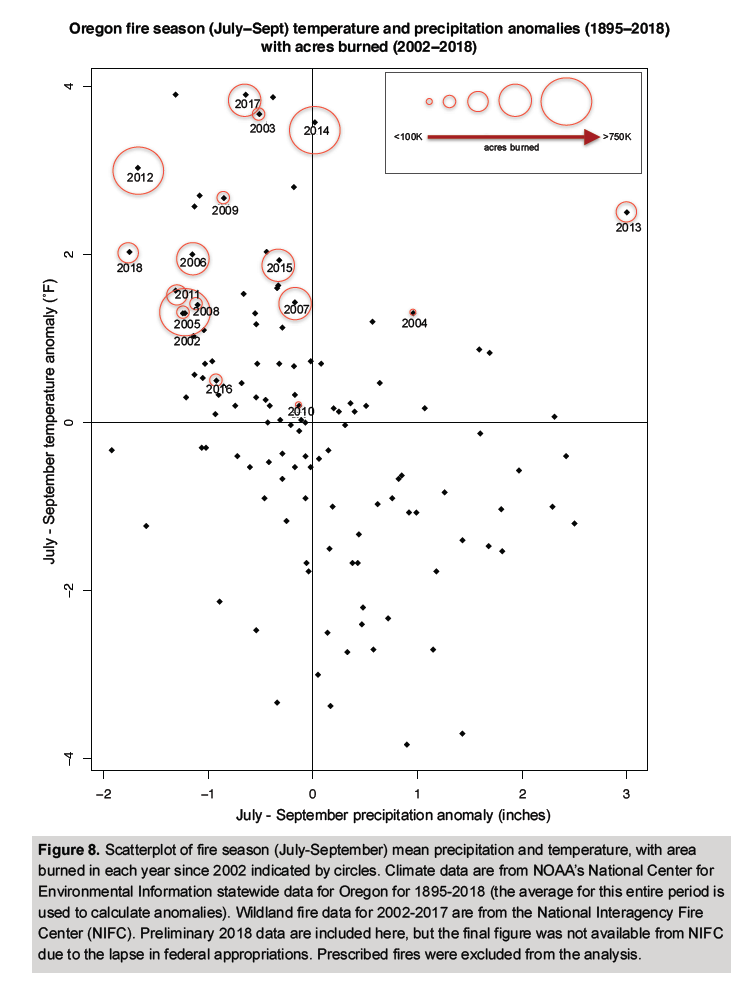
The fire danger is obviously a big issues locally, with recent large fires throughout the state and the larger West Coast region. The connection between higher temperatures and lower precipitation and how this leads to bigger fires is driven home by Figure 8, which provides a scatterplot of fires and intensity through acres burned with the biggest fires, quite logically happening in the driest, hottest years. To me it’s just as much the correlation as the fact that it only requires a few degrees of warmer temps and a few inches less precipitation to amplify the fires, and shows a future we’ve all seen of what summers may be like as the new normal in the Pacific Northwest.
The report wraps up with discussions of sea level rise, which show slightly higher impacts, with worst case scenarios speculating a 8.2 foot rise by 2100, and intermediate estimates of around 1 meter of rise (approximately 3.3′). There’s also some discussion about ‘Potential surprises’, which discuss uncertainty, echoing other climate reports, most significantly on the difficulty in. Those positive feedbacks, or self-refinforcing cycles, have the
“…potential to accelerate human-induced climate change and event shift the Earth’s climate system, in part or in-while, into new states that are very different from those experienced in the recent past.” (p.10)
Our ability to model and predict those impacts and the interrelationship of multiple impact compounded by simultaneous events, such as flooding at the same time that grounds are saturated, or wildfires coming during droughts, need to be more fully analyzed. We need more input to determine the suite of processes combining for these “compound extreme events”. This multiplier effect, coupled with the realization that many “climate models are more likely to underestimate than to overestimate the amount of long-term future change” that will occur, means the effects, singular and multiple, may be even more extreme than we can imagine. (p.10)
The final section of the report, Chapter 2, is a full version of the Fourth National Climate Assessment, Chapter 24, which focused on the specific information compiled for the Northwest Region. More to come on that when I discuss some of the relevant information contained within the full NCA4.
More to come on some of the great resources that OCCRI has developed including wanting to look at the Tribal Climate Adaptation Guidebook, which linked specifically to a site of Guidelines for Considering Traditional Knowledges in Climate Change Initiatives.
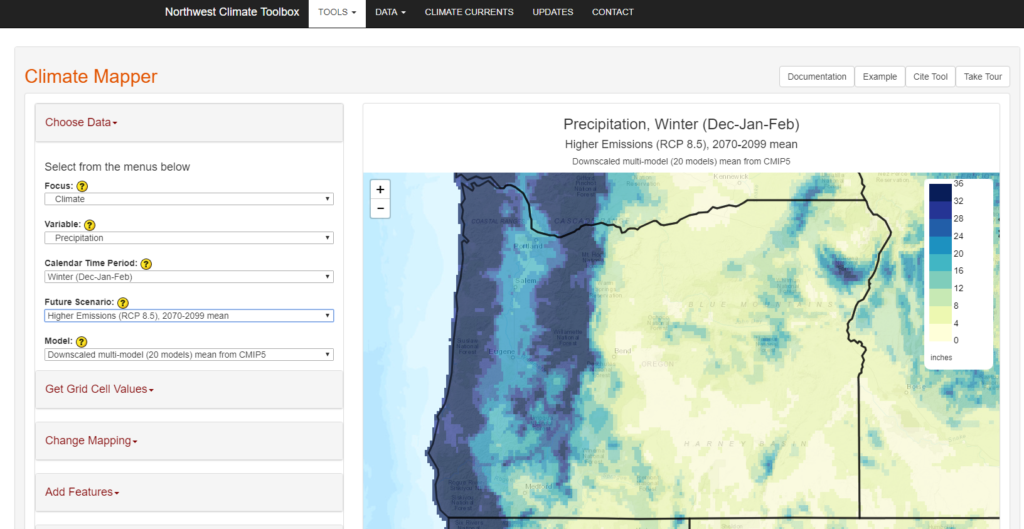
My other big takeaway as well from this Oregon-specific take on climate is the amazing set of tools available in the Northwest Climate Toolbox, referenced in the report and responsible for many of the Oregon-specific visuals. This “collection of web tools for visualizing past and projected climate and hydrology of the Pacific Northwest” will be an essential resource for future study. More to come there.
HEADER: Snapshot of modeled precipitation change from RCP8.5 from 2040-2069 – via NW Climate Toolbox
